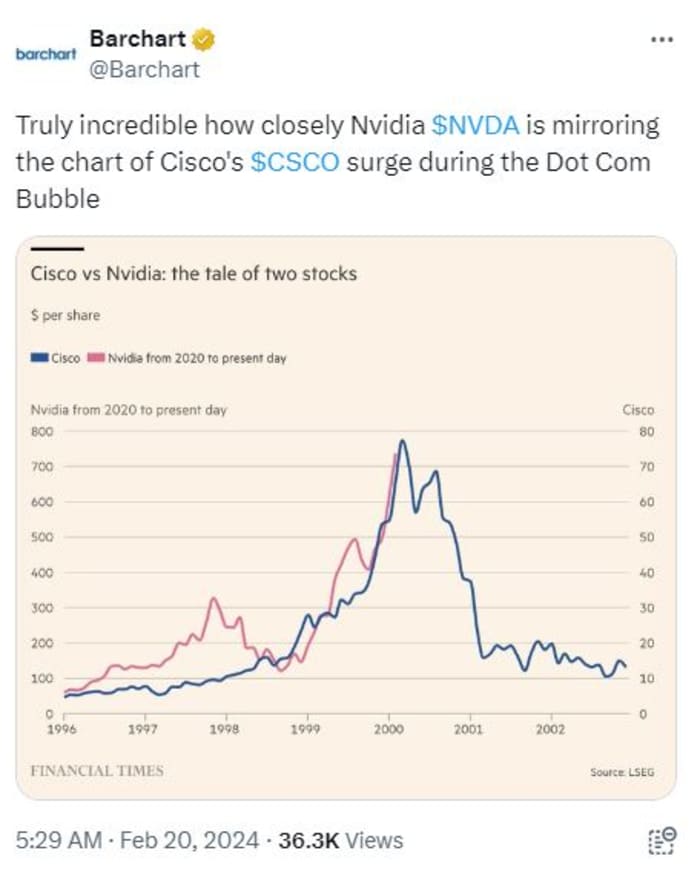
The U.S. post-holiday mood looks jittery for Tuesday, with Big Tech stocks such as Nvidia dipping ahead of the open, one day ahead of highly anticipated results.
As MarketWatch’s Joe Adinolfi recently explained, Nvidia
NVDA,
earnings could prove a momentum killer for markets, given bullish investor bets on stocks.
Our call of the day warns that it’s not just giddy investors that could take down the market, but Wall Street analysts themselves. Ed Yardeni, president of Yardeni Research, and his team have been on the hunt for signals that will help them spot market meltups, such as a rapid rise in stock prices.
“Such moves can feed on themselves. The feedback loop occurs when rapidly rising share prices convince industry analysts that they need to raise their estimates for the revenues, earnings, and profit margins of their companies,” says Yardeni.
Wall Street analysts try to justify those estimate increases by convincing themselves and clients that fundamentals have vastly improved, “which is why the stocks of the companies have moved higher than they had expected and is why they are scrambling to raise their estimates,” he said, in a note.
“There is no point in fighting the market. Your followers will hate you for not validating their enthusiasm. If this sounds like mob psychology rather than financial analysis, that’s because it is,” says Yardeni.
While Yardeni is the most bullish analyst on Wall Street, he prefers a “leisurely” market that “allows underlying fundamentals to support it.” What he fears is that the above-described feedback loop will fuel a stock meltup — typically followed by meltdowns.
He and his team looked at data showing industry analysts’ consensus expected long-term earnings growth (LTEG) for S&P 500
SPX
companies. It reflects analysts’ annualized expected earnings growth over the next three to five years — weekly data is available from 1985. That average growth rate has been 12.5%, versus nominal GDP growth that has averaged 6.3% since 1948, he notes.
“The earnings of the overall stock market can’t grow twice as fast as the economy does. We conclude that industry analysts are naturally too bullish on the long-term earnings prospects of the companies they follow. Very few of them choose to cover companies that have sub-average earnings growth or might go out of business,” he says.
He highlights some past LTEG meltups. One occurred during the late 1990s tech bubble — then LTEG peaked at 18.7% during the week of Sept. 7, 2000. Another came in 2018 following a corporate tax rate cut that lifted margins — it peaked at 17.6% on Oct. 10, 2018. The LTEG currently sits at 18.4%, right in line with prior elevated meltup readings, he notes.
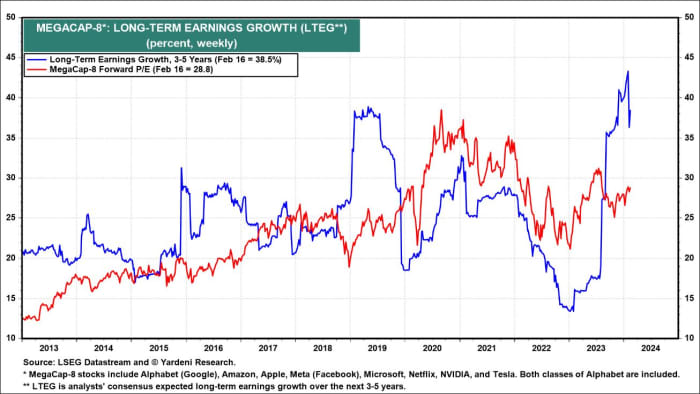
They also calculated an LTEG series for the MegaCap 8 stocks — Alphabet
GOOGL,
Amazon
AMZN,
Apple
AAPL,
Meta
META,
Microsoft
MSFT,
Netflix
NFLX,
Nvidia
NVDA,
and Tesla
TSLA,
Given those account for a whopping 28.2% of the S&P 500’s market capitalization, their LTEG carries heft in the index overall, says the strategist.
“The latest data show that the MegaCap-8’s LTEG soared from 17.5% at the end of July to a record 43.3% at the end of January. It settled down to 38.5% during the February 16 week. Leading the way recently was Nvidia’s LTEG, which exploded from 21.2% at the end of August to 102.5% most recently,” said Yardeni.
The markets
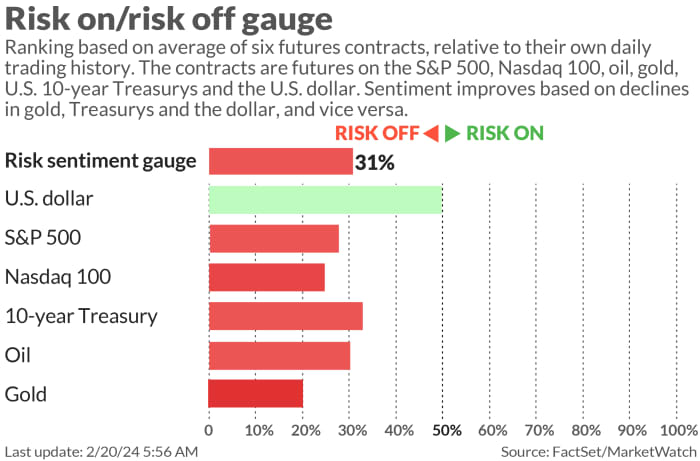
U.S. stock-index futures
ES00,
NQ00,
are pointing to a lower start, led by tech stocks
NQ00,
while Treasury yields
BX:TMUBMUSD10Y
BX:TMUBMUSD02Y
are mostly steady. Gold
GC00,
is climbing, while silver
SI00,
is falling.
| Key asset performance | Last | 5d | 1m | YTD | 1y |
| S&P 500 | 5,005.57 | -0.32% | 3.20% | 4.94% | 22.71% |
| Nasdaq Composite | 15,775.65 | -1.34% | 3.03% | 5.09% | 33.84% |
| 10 year Treasury | 4.287 | -3.01 | 14.93 | 40.62 | 33.16 |
| Gold | 2,033.20 | -0.03% | 0.50% | -1.86% | 9.83% |
| Oil | 78.17 | 1.60% | 4.69% | 9.59% | 2.10% |
| Data: MarketWatch. Treasury yields change expressed in basis points | |||||
The buzz
Capital One
COF,
announced a $35 billion all-stock deal to buy Discover Financial Services
DFS,
creating the “create the largest card issuer in the U.S.,” says one analyst. Discover is up 12%, Capital One is down 5% in premarket.
Walmart
WMT,
stock is up after the retailer reported an earnings beat and a deal to buy TV maker Vizio
VZIO,
for $2.3 billion.
. Home Depot’s
HD,
results and outlook disappointed and shares are down. Palo Alto Networks
PANW,
and Caesars Entertainment
CZR,
will report after the close.
Goldman Sachs lifted its S&P 500 forecast to 5,200, but that hinges a lot on continued strong performance from Big Tech stocks.
U.S. leading economic indicators are due at 10 a.m., in a light data week that includes minutes of the Federal Reserve’s January meeting and several Fed speakers.
China made the biggest-ever cut to its five-year mortgage rate, which didn’t help the stock market
CN:SHCOMP
XX:000300
too much. A day earlier, data showed the country’s biggest travel surge since COVID.
Best of the web
Ozempic may force junk food makers to rewrite their game plans
Making money on I Bonds was easy. The tax paperwork isn’t.
International sting busts cybercrime gang that disrupted the U.S. Treasury market
The chart
Since the SVB banking collapse in 2023, the biggest S&P 500 names have been tightly aligned with trends in 10-year yields, notes Lori Calvasina, head of U.S. equity strategy at RBC Capital, who provides the below chart:
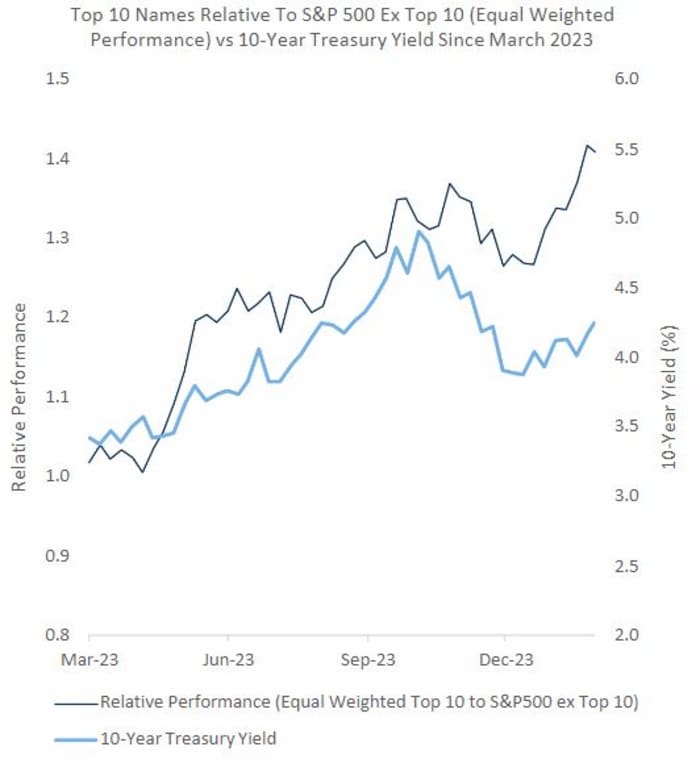
“Investors often ask us what will spark a shift in leadership away from the biggest names. Our answer these days is a decline in 10-year yields, getting past the start of Fed cuts, and an improvement in U.S. economic forecasts (since growth and large cap tend to lead when GDP is below trend). We continue to expect a broadening of market leadership but think it will take some time to play out,” Calvasina told clients in a note.
Top tickers
These were the top-searched tickers on MarketWatch as of 6 a.m.:
| Ticker | Security name |
|
NVDA, |
Nvidia |
|
TSLA, |
Tesla |
|
SMCI, |
Super Micro Computer |
|
AAPL, |
Apple |
|
OCGN, |
Ocugen |
|
NIO, |
Nio |
|
MARA, |
Marathon Digital |
|
AMD, |
Advanced Micro Devices |
|
AMZN, |
Amazon |
|
COIN, |
Coinbase Global |
Random reads
Harry Styles — the new Taylor Swift of U.K. soccer?
Man sues after Powerball says his $340 million lottery win was a mistake.
Need to Know starts early and is updated until the opening bell, but sign up here to get it delivered once to your email box. The emailed version will be sent out at about 7:30 a.m. Eastern.
Check out On Watch by MarketWatch, a weekly podcast about the financial news we’re all watching – and how that’s affecting the economy and your wallet. MarketWatch’s Jeremy Owens trains his eye on what’s driving markets and offers insights that will help you make more informed money decisions. Subscribe on Spotify and Apple.