
The FTSE 100 is rising today. But, since last Wednesday it has fallen 7%. Looking back to the most recent high of 8,014, which hit on 20 February 2023, the FTSE 100 is down 8%.
Explanations as to why this has happened are plentiful and I won’t be repeating them here. What I want to work out is what I should be doing when the markets are not in rude health.
Stock market crashes and corrections
When it comes to stock market movements, there are a few terms that the investing community agree on. These are:
- Crash: an abrupt, typically double-digit percentage drop which occurs over hours or days
- Correction: a decline of 10% to 20% from a recent high, typically over weeks to months
- Bear market: a drop of more than 20% from a recent high, typically measured over months to years
- Bull market: a rise of more than 20% from a recent low, typically measured over weeks to months
Right now, the FTSE 100 is not quite crashing, and it’s not correcting or in a bear market. But as someone who keeps an eye on financial news, it certainly feels like it is.
Type “bull market” into a Google news search and 9,260,000 results are delivered. Search for “bear market” and the results are doubled to 18,100,000. Panic-inducing headlines are more common than their converse. Bad news, it appears, sells more. And I likely consume more of it, whether I want to or not, compared to more positive headlines.
Economists Daniel Kahneman and Amos Tversky discovered that people feel more pain losing £200 than they will joy when gaining £200. They called this phenomenon ‘loss aversion’. Those Google news search results suggest that headlines that warn of pain get more attention. I certainly find myself checking my portfolio when markets are dropping. I am certain I overact to declines and underreact to gains.
Catching the FTSE 100
According to Forbes, bear markets last 289 days and happen every 5.4 years on average. Bull markets are longer (973 days on average) and occur more frequently. The average length of bull markets is 973 days and they occur more frequently.
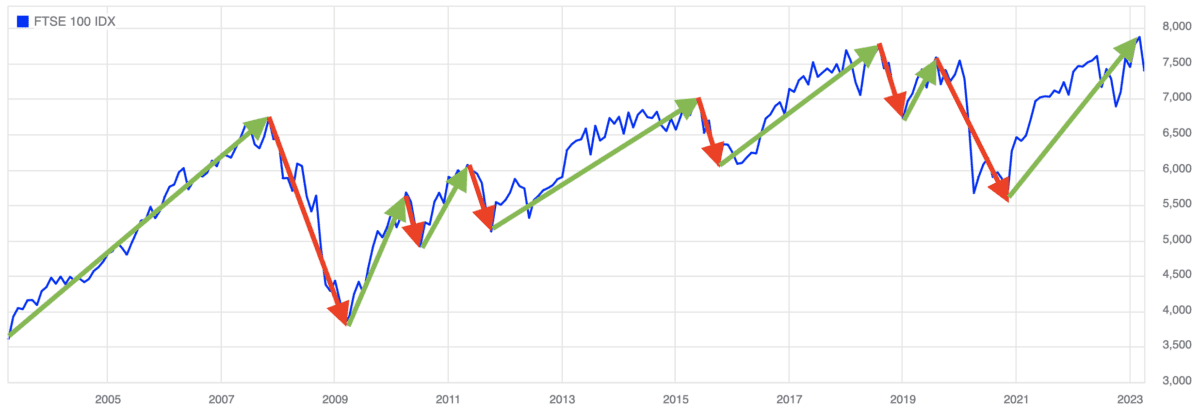
A graph of the FTSE 100 price since 2003 backs this up. Measure moves of 10% or more and the periods of gain are more frequent and cumulatively last longer than the periods of loss.
Since I regularly invest my spare money, then I am more likely to be buying at higher and higher prices. And I will do this quite happily. Yet when markets drop, I will want to stop investing. I won’t want to catch a falling knife, because I will likely get cut, right?
Well, maybe I will. But I could be buying at lower prices ahead of a transition to a rising market. That’s something I should be doing. And given I have decades before I need to start drawing my investment portfolio it makes sense that I do just that.