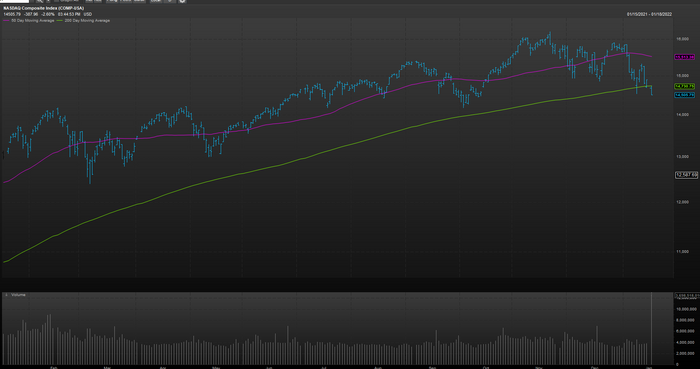
The Nasdaq Composite Index notched its first close below a closely watched, long-term trend line since April of 2020, and investors may be wondering how the benchmark tends to perform in the near to immediate-term after slipping below that mark.
On Tuesday, following the holiday in observance of Martin King Luther Jr. Day, the Nasdaq Composite
COMP,
tumbled 2.6% to 14,506, nearing its correction level at 14,451.69, which would represent a decline of 10% from its Nov. 19 record close and meet the common definition of a correction.
However, in the interim, the index breached another important level that market technicians view as the dividing line between bullish and bearish momentum in an asset. The Nasdaq Composite’s 200-day moving average stands at 14,730,75, FactSet data show.
The close below the 200-day trend line put an end to a streak that has lasted nearly 440 trading sessions, or well over a year.
FactSet
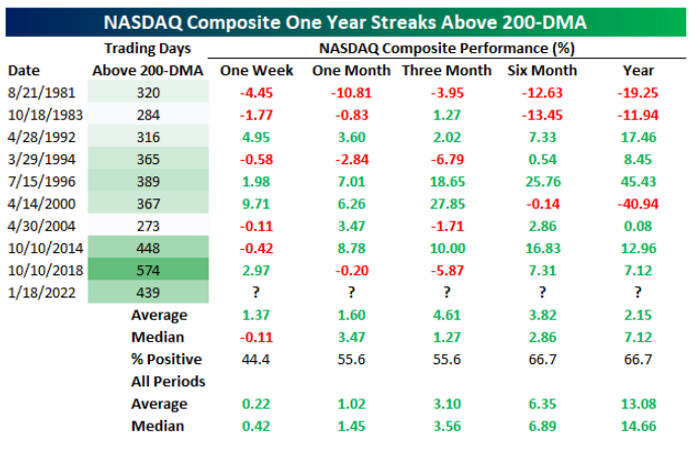
The question, however, is how does the Nasdaq Composite tend to perform once it has stumbled below the 200-day MA after a streak of at least a year, and the folks at Bespoke Investment Group have some insights.
In the short term, it isn’t good.
“Historically, one-week performance has tended to be negative following the first close below the 200-DMA with positive performance only 44% of the time and a median decline of 0.11%,” Bespoke researchers write.
But things get better over time.
“One and three months later have seen the NASDAQ rise a little better than half the time. Six to 12 months later have been positive more consistently with a move higher two-thirds of the time, but the median and average gains are smaller than the norm,” BIG writes.
Bespoke Investment Group
Meanwhile, the Dow Jones Industrial Average
DJIA,
closed 1.5% lower near 35,368, while the S&P 500
SPX,
ended down 1.8%, at about 4,577, falling below the psychologically significant level at 4,600.
Stocks fell sharply as Treasury yields rose in anticipation of the Federal Reserve tightening monetary policy this year. The rate-setting Federal Open Market Committee next meets on Jan. 25-26 and is likely to set the stage for a series of rate increases, and policy tightenings as it combats inflation.
With that looming, the yield on the 10-year Treasury note BX:TMUBMUSD10Y was trading around eight basis points higher Tuesday afternoon at about 1.87%, its highest level in about two years, while the 2-year Treasury note’s BX:TMUBMUSD02Y, which are more sensitive to Fed policy expectations, rate shot up 8 basis points to about 1%.
Check out: Here’s how the Federal Reserve may shrink its $8.77 trillion balance sheet to combat high inflation
Rising yields are weighing on the yield-sensitive tech stocks and growth themed areas of the market because increased borrowing costs and rates mean that investors have to discount the value of a company’s future cash flows, and that is causing a broad recalibration of tech and tech-related shares that populate the Nasdaq.
Read:Worried about a bubble? Why you should overweight U.S. equities this year, according to Goldman