Technology stocks have dominated during March, with remarkable gains for a sector that tumbled last year. Meanwhile, two high-profile bank failures have taken their toll on the financial sector — but maybe that sector has performed better than you expected.
Below are lists of the month’s best and worst performing stocks in the S&P 500
SPX,
followed by lists for the Nasdaq-100 Index
NDX
and the Dow Jones Industrial Average
DJIA.
First, take a look at how the 11 sectors of the S&P 500 have fared this month. Performance and forward price-to-earnings valuations for the broad indexes are below the sectors:
| Index | March price change | 2023 price change | 2022 price change | Forward P/E | Forward P/E – Dec. 30, 2022 | Forward P/E – Dec. 31, 2021 |
| Information Technology | 9.3% | 19.7% | -28.9% | 24.1 | 20.0 | 28.2 |
| Communication Services | 8.1% | 17.7% | -40.4% | 16.2 | 14.4 | 20.9 |
| Utilities | 3.8% | -4.8% | -1.4% | 17.6 | 18.8 | 20.4 |
| Consumer Staples | 3.0% | -0.7% | -3.2% | 20.1 | 20.6 | 21.4 |
| Healthcare | 0.9% | -5.8% | -3.6% | 17.0 | 17.7 | 17.2 |
| Consumer Discretionary | 0.4% | 12.8% | -37.6% | 25.0 | 21.5 | 34.2 |
| Industrials | -0.8% | 1.7% | -7.1% | 18.5 | 18.4 | 21.2 |
| Energy | -1.1% | -6.2% | 59.0% | 10.1 | 9.8 | 11.1 |
| Materials | -2.9% | 2.1% | -14.1% | 16.4 | 15.7 | 16.6 |
| Real Estate | -4.2% | -1.1% | -28.4% | 16.8 | 17.1 | 25.3 |
| Financials | -10.8% | -7.1% | -12.4% | 12.5 | 12.9 | 16.1 |
| S&P 500 | 2.0% | 5.5% | -19.4% | 17.8 | 16.8 | 21.5 |
| Dow Jones Industrial Average | 0.6% | -0.9% | -8.8% | 16.7 | 16.6 | 18.9 |
| Nasdaq Composite Index | 4.9% | 14.8% | -33.1% | 25.8 | 22.4 | 31.6 |
| Nasdaq-100 Index | 7.6% | 18.5% | -33.0% | 24.7 | 21.0 | 30.6 |
| Source: FactSet | ||||||
All price changes in this article exclude dividends.
The IT sector has seen a considerable rebound, accelerating in March. The communications Services sector has trailed closely.
Sector placement can be confusing for some companies when considering how they are perceived by investors. Both Meta Platforms Inc.
META
and Alphabet Inc.
GOOGL
are in the communications sector. Both are among the best performers in the S&P 500 during March, listed below.
Read: Are tech stocks becoming a haven again? ‘It’s a mistake,’ say market analysts.
Despite such a strong showing for the benchmark index, only 220 stocks in the S&P 500 have risen during March. This reflects the index’s weighting by market capitalization.
Here are the 20 stocks in the S&P 500 that have performed best this month:
| Company | Ticker | March price change | 2023 price change | 2022 price change | Forward P/E | Forward P/E as of Dec. 31 |
| Intel Corp. | INTC | 28.7% | 21.4% | -48.7% | 40.0 | 14.6 |
| First Solar Inc. | FSLR | 26.1% | 42.4% | 71.9% | 26.3 | 29.4 |
| Advanced Micro Devices Inc. | AMD | 24.6% | 51.1% | -55.0% | 28.9 | 17.8 |
| Salesforce Inc. | CRM | 20.2% | 48.3% | -47.8% | 26.5 | 23.7 |
| Meta Platforms Inc. Class A | META | 18.8% | 72.7% | -64.2% | 19.6 | 14.7 |
| Nvidia Corp. | NVDA | 17.9% | 87.4% | -50.3% | 57.9 | 34.4 |
| Adobe Inc. | ADBE | 17.9% | 13.5% | -40.7% | 23.6 | 21.8 |
| Arista Networks Inc. | ANET | 17.2% | 33.9% | -15.6% | 27.2 | 22.3 |
| Insulet Corp. | PODD | 14.7% | 7.6% | 10.6% | 213.1 | 260.4 |
| Microsoft Corp. | MSFT | 13.9% | 18.4% | -28.7% | 27.2 | 23.1 |
| Kroger Co. | KR | 13.7% | 10.0% | -1.5% | 10.9 | 10.6 |
| MarketAxess Holdings Inc. | MKTX | 13.6% | 39.1% | -32.2% | 48.0 | 37.1 |
| Illumina Inc. | ILMN | 13.1% | 11.4% | -46.9% | 121.1 | 66.0 |
| Cooper Companies Inc. | COO | 12.4% | 11.1% | -21.1% | 27.2 | 25.6 |
| Chipotle Mexican Grill Inc. | CMG | 12.1% | 20.5% | -20.6% | 37.8 | 32.3 |
| Alphabet Inc. Class A | GOOGL | 12.0% | 14.3% | -39.1% | 18.7 | 16.9 |
| Newmont Corp. | NEM | 12.0% | 3.5% | -23.9% | 21.5 | 24.9 |
| Verisk Analytics Inc. | VRSK | 11.6% | 8.2% | -22.9% | 33.7 | 31.5 |
| Domino’s Pizza Inc. | DPZ | 11.4% | -5.4% | -38.6% | 24.3 | 24.3 |
| Activision Blizzard Inc. | ATVI | 11.3% | 10.9% | 15.1% | 21.6 | 19.6 |
| Source: FactSet | ||||||
Click on the tickers for more about each company.
Read Tomi Kilgore’s detailed guide to the wealth of information available for free on the MarketWatch quote page.
Intel Corp.
INTC
has been the best performer among the S&P 500 in March. A long-term chart for the stock is below the Nasdaq-100 list further down.
Here are the worst 20 performers in the benchmark index in March, mainly reflecting investors’ concerns about regional banks:
| Company | Ticker | March price change | 2023 price change | 2022 price change | Forward P/E | Forward P/E as of Dec. 31 |
| First Republic Bank | FRC | -88.9% | -88.8% | -41.0% | 4.1 | 17.1 |
| Zions Bancorporation N.A. | ZION | -40.1% | -38.4% | -22.2% | 4.8 | 7.3 |
| Comerica Inc. | CMA | -37.1% | -34.1% | -23.2% | 4.7 | 6.6 |
| Charles Schwab Corp | SCHW | -32.7% | -37.0% | -1.0% | 12.5 | 17.1 |
| KeyCorp | KEY | -32.3% | -28.9% | -24.7% | 6.1 | 7.5 |
| Lincoln National Corp | LNC | -31.2% | -28.9% | -55.0% | 2.5 | 3.4 |
| Truist Financial Corp. | TFC | -27.9% | -21.3% | -26.5% | 6.9 | 8.2 |
| Fifth Third Bancorp | FITB | -27.5% | -19.8% | -24.7% | 7.0 | 8.2 |
| Huntington Bancshares Inc. | HBAN | -27.3% | -21.0% | -8.6% | 7.4 | 9.0 |
| Citizens Financial Group Inc. | CFG | -26.3% | -21.8% | -16.7% | 6.2 | 7.7 |
| U.S. Bancorp | USB | -25.7% | -18.7% | -22.4% | 7.1 | 8.6 |
| M&T Bank Corp. | MTB | -23.0% | -17.6% | -5.5% | 6.8 | 7.7 |
| Regions Financial Corp. | RF | -21.4% | -15.0% | -1.1% | 7.3 | 8.6 |
| Dish Network Corp. Class A | DISH | -21.0% | -35.8% | -56.7% | 8.0 | 8.6 |
| MetLife Inc. | MET | -20.5% | -21.2% | 15.8% | 6.7 | 8.7 |
| Wells Fargo & Co. | WFC | -20.1% | -9.5% | -13.9% | 7.7 | 8.0 |
| Synchrony Financial | SYF | -20.1% | -13.1% | -29.2% | 5.5 | 6.4 |
| PNC Financial Services Group Inc. | PNC | -19.6% | -19.6% | -21.2% | 8.6 | 9.8 |
| Boston Properties Inc. | BXP | -18.6% | -21.1% | -41.3% | 24.1 | 31.3 |
| American International Group Inc. | AIG | -18.5% | -21.2% | 11.2% | 7.6 | 10.0 |
| Source: FactSet | ||||||
First Republic Bank
FRC
of San Francisco has been the worst-performing stock in the S&P 500 this month because of deposit outflow in the wake of similar trouble that caused the failures of Silicon Valley Bank on March 10 and the failure of Signature Bank of New York on March 12.
Read: Here’s how First Republic Bank’s tailspin started and why it hasn’t stopped.
One reason the financial sector has declined “only” 10.8% this month is that there was some reclassification of sectors by S&P Dow Jones Indices. Visa Inc.
V,
Mastercard Inc.
MA
and PayPal Holdings Inc.
PYPL
have all moved to the financials sector from the tech sector. Two other large components of the financial sector — Berkshire Hathaway Inc.
BRK
and S&P Global Inc.
SPGI
— are flat this month. The five companies together have a combined market cap of $1.39 billion, or 31% of the sector’s $4.51 trillion market cap.
Nasdaq-100
The Nasdaq-100 index is made up of the largest 100 nonfinancial companies in the full Nasaq Composite Index
COMP,
by market cap. Here are the 10 components of the index that have performed the best during March:
| Company | Ticker | March price change | 2023 price change | 2022 price change | Forward P/E | Forward P/E as of Dec. 31 |
| Intel Corp. | INTC | 28.7% | 21.4% | -48.7% | 40.0 | 14.6 |
| Advanced Micro Devices Inc. | AMD | 24.6% | 51.1% | -55.0% | 28.9 | 17.8 |
| Meta Platforms Inc. Class A | META | 18.8% | 72.7% | -64.2% | 19.6 | 14.7 |
| Nvidia Corp. | NVDA | 17.9% | 87.4% | -50.3% | 57.9 | 34.4 |
| Adobe Inc. | ADBE | 17.9% | 13.5% | -40.7% | 23.6 | 21.8 |
| Lululemon Athletica Inc. | LULU | 15.8% | 11.8% | -18.2% | 30.3 | 28.3 |
| Microsoft Corp. | MSFT | 13.9% | 18.4% | -28.7% | 27.2 | 23.1 |
| Illumina Inc. | ILMN | 13.1% | 11.4% | -46.9% | 121.1 | 66.0 |
| Seagen Inc. | SGEN | 13.0% | 58.0% | -16.9% | N/A | N/A |
| Alphabet Inc. Class A | GOOGL | 12.0% | 14.3% | -39.1% | 18.7 | 16.9 |
| Source: FactSet | ||||||
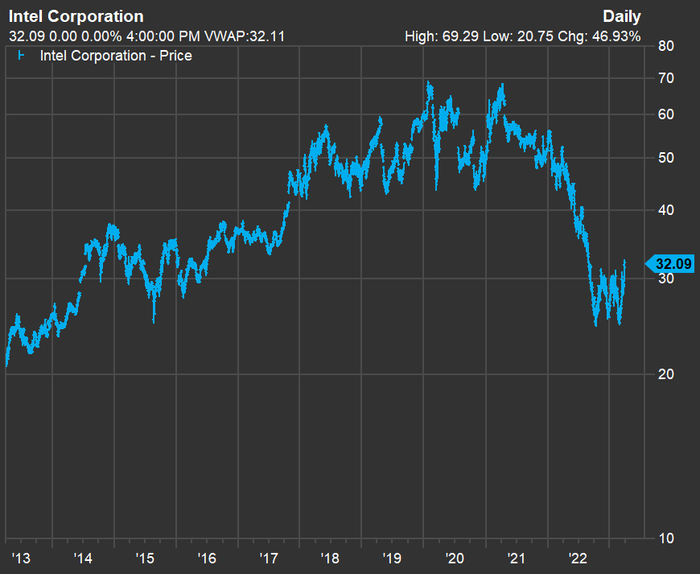
To put Intel’s 2003 surge into perspective, here’s a 10-year chart for the stock:
Intel’s stock has surged 21% in 2023 following a 49% decline last year.
FactSet
Read: Intel’s stock set for best month in 22 years as execs lay out plans to take on AMD’s rise in servers
The Dow 30
Here’s how all 30 components of the Dow Jones Industrial Average have performed in March:
| Company | Ticker | March price change | 2023 price change | 2022 price change | Forward P/E | Forward P/E as of Dec. 31 |
| Intel Corp. | INTC | 28.7% | 21.4% | -48.7% | 40.0 | 14.6 |
| Salesforce Inc. | CRM | 20.2% | 48.3% | -47.8% | 26.5 | 23.7 |
| Microsoft Corp. | MSFT | 13.9% | 18.4% | -28.7% | 27.2 | 23.1 |
| Apple Inc. | AAPL | 10.1% | 25.0% | -26.8% | 25.8 | 20.5 |
| Procter & Gamble Co. | PG | 7.2% | -2.7% | -7.3% | 23.8 | 25.2 |
| Cisco Systems Inc. | CSCO | 6.2% | 8.0% | -24.8% | 13.0 | 13.0 |
| McDonald’s Corp. | MCD | 5.3% | 5.4% | -1.7% | 25.6 | 25.1 |
| Boeing Co. | BA | 4.7% | 10.8% | -5.4% | 146.4 | 53.7 |
| Amgen Inc. | AMGN | 4.2% | -8.0% | 16.7% | 13.2 | 14.2 |
| Coca-Cola Co. | KO | 3.9% | -2.8% | 7.4% | 23.4 | 25.2 |
| Walmart Inc. | WMT | 2.5% | 2.7% | -2.0% | 23.4 | 21.7 |
| Nike Inc. Class B | NKE | 1.1% | 2.6% | -29.8% | 30.9 | 32.6 |
| Visa Inc. Class A | V | 1.1% | 7.0% | -4.1% | 24.5 | 24.1 |
| Chevron Corp. | CVX | 1.0% | -9.5% | 53.0% | 10.8 | 10.9 |
| Johnson & Johnson | JNJ | 0.1% | -13.1% | 3.3% | 14.5 | 17.0 |
| International Business Machines Corp. | IBM | -0.1% | -8.3% | 5.4% | 13.4 | 14.7 |
| Merck & Co. Inc. | MRK | -0.3% | -4.5% | 44.8% | 14.5 | 14.8 |
| Verizon Communications Inc. | VZ | -0.4% | -1.9% | -24.2% | 8.2 | 7.9 |
| Honeywell International Inc. | HON | -1.2% | -11.7% | 2.8% | 20.3 | 23.3 |
| UnitedHealth Group Inc. | UNH | -1.2% | -11.3% | 5.6% | 18.2 | 21.3 |
| Walt Disney Co. | DIS | -1.5% | 12.9% | -43.9% | 20.4 | 19.5 |
| Walgreens Boots Alliance Inc. | WBA | -2.5% | -7.3% | -28.4% | 7.4 | 8.1 |
| Home Depot Inc. | HD | -3.8% | -9.7% | -23.9% | 17.8 | 18.7 |
| 3M Co. | MMM | -4.6% | -14.3% | -32.5% | 11.6 | 11.5 |
| Dow Inc. | DOW | -5.6% | 7.2% | -11.2% | 14.9 | 11.5 |
| Caterpillar Inc. | CAT | -6.3% | -6.3% | 15.9% | 13.9 | 15.7 |
| American Express Co. | AXP | -6.7% | 9.9% | -9.7% | 14.1 | 13.7 |
| Travelers Cos. Inc. | TRV | -7.7% | -8.9% | 19.9% | 11.4 | 12.8 |
| Goldman Sachs Group Inc. | GS | -8.7% | -6.5% | -10.2% | 9.0 | 9.2 |
| JPMorgan Chase & Co. | JPM | -10.2% | -4.0% | -15.3% | 9.8 | 10.4 |
| Source: FactSet | ||||||
Don’t miss: 11 stocks in the S&P 500 expected to form an exclusive growth club for investors