
The S&P 500 has managed to tread water in March despite the collapse of three U.S. banks and lingering worries about deposit flight from other regional lenders. But beneath the surface, signs of equity-market weakness abound.
To be sure, the S&P 500
SPX,
the most widely followed gauge of U.S. stock-market performance by investment professionals, has changed little in the weeks since March 8 — the day that Silicon Valley Bank first announced a doomed capital raise after being forced to sell a slug of Treasury and mortgage bonds at a loss. It was taken over by federal authorities two days later.
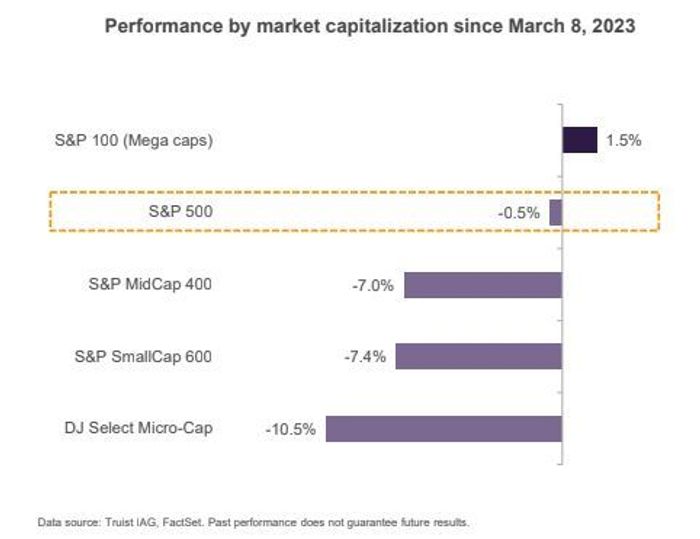
But the performance of the large-cap S&P 500 doesn’t reflect weakness in small-cap stocks and cyclical names, which haven’t held up nearly as well as the largest U.S. stocks by market capitalization.
See: Why the worst banking mess since 2008 isn’t freaking out stock-market investors — yet
Keith Lerner, chief market strategist at Truist, illustrated this dichotomy in performance between the biggest U.S.-traded stocks and the rest of the market in a note shared with clients and MarketWatch on Monday.
According to Lerner, investors have gravitated toward the largest U.S. companies because of their stronger balance sheets and more diversified businesses, which should help them fare better during a recession. This is why shares of Nvidia Corp.
NVDA,
Apple Inc.
AAPL,
Microsoft Corp.
MSFT,
Google parent Alphabet Inc.
GOOGL,
and Facebook parent Meta Platforms Inc.
META,
have fared so well in recent weeks.
“Although some investors may look at the strength seen in some of the popular market indices as a positive sign, weakness is evident below the surface, and macro risks are growing,” Lerner said.
To wit, gauges of small- and midcap U.S. stocks have fared far worse than the S&P 500
SPX,
Through Friday, the S&P 500 was down 0.5% since March 8, according to Truist. But the S&P Midcap 400 index had fallen by 7% during the same period, while the S&P SmallCap 600 index was down 7.4%.
TRUIST
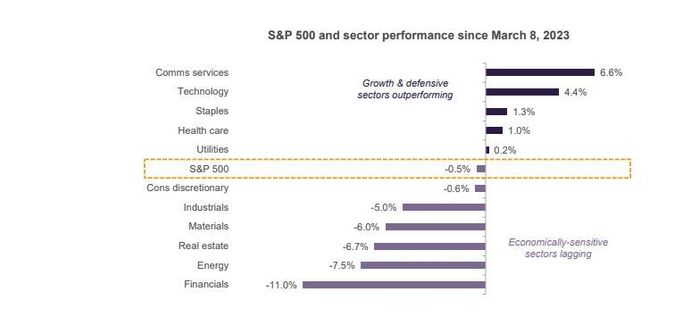
Cyclical sectors like energy stocks, consumer discretionary stocks, materials, industrials, real estate and — of course — financials also fared worse than the broader S&P 500 index. Perhaps unsurprisingly, financials have fared the worst, having fallen by 11% since March 8, according to FactSet.
Energy is the second-worst-performing sector, down 7.5%, with real estate coming in third with a drop of 6.7%.
TRUIST
Looking ahead, Lerner expects this dichotomy in performance to persist as investors grapple with the increasing likelihood of a recession beginning before the end of 2023.
The bond market is already pricing in a high likelihood of recession, which is why the 2-year Treasury yield
TMUBMUSD02Y,
is suggesting 100 basis points of Fed rate cuts will likely arrive before the end of the year. It was trading at 3.777% as of the end of Friday, according to FactSet data.
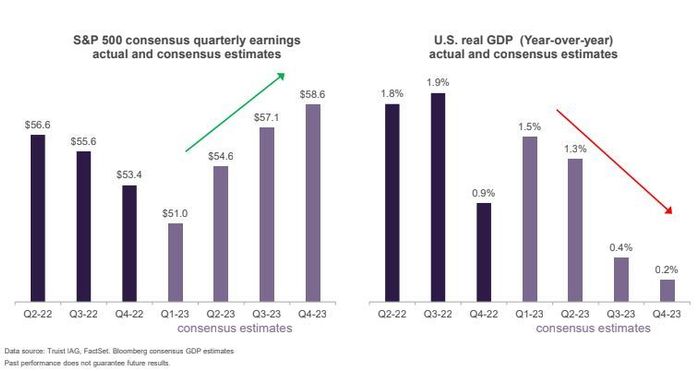
And estimates for gross domestic product show as growth is expected to slow later in the year.
TRUIST
That doesn’t quite square with the consensus estimates for corporate earnings. According to FactSet, earnings are expected to rebound to record levels by the fourth quarter.
Recession fears, however, offer one reason why Truist expects large-cap names to continue to outperform. Some of the megacap technology names were among the market’s worst performers last year, or otherwise suffered substantial double-digit losses. Meta fell by more than 64% last year, while Microsoft shed nearly 29% and Apple declined by nearly 27%, according to FactSet. By comparison, the S&P 500 fell 19.4%, without accounting for dividends.
U.S. stocks were mostly higher on Monday, with the S&P 500 on track for a modest 0.2% gain, while the Dow Jones Industrial Average
DJIA,
was up around 185 points, or 0.6%. The Nasdaq Composite
COMP,
was the only one of the three main U.S. indexes to trade in the red, with a drop of 0.5%.